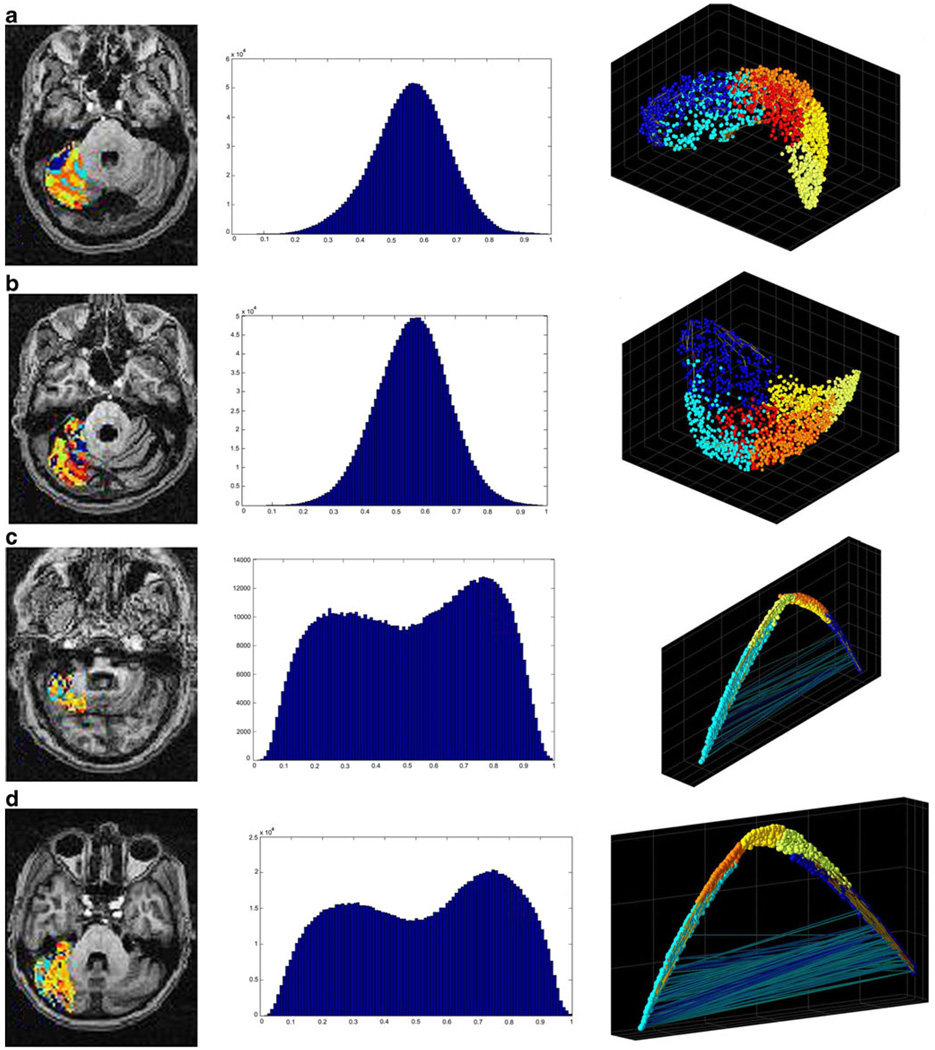
Fig. 4.
Graphical representation of the intrinsic functional organization in lateral cerebellum. Row a represents the holographic analysis in a healthy control subject. b The results for subject SCA-002, c for subject SCA-010, and d for subject SCA-008. Please refer to Table 1 for the specific clinical characteristics for each SCA patient. The first column shows the anatomical distribution of functional clusters found in lateral cerebellum. Note that the concentric arrangement seen in healthy subjects is progressively lost in the SCA1 subjects (including those with less severe disease). The second column shows the statistical distribution of the correlation coefficients in lateral cerebellum. In this case, the normality seen in all control subjects is progressively lost. The third column shows the functional manifold or magnitude reduction as seen by the first three principal components. In this case, not only the distribution changes, but in the most severe cases, it is apparent the presence of high negative correlations among clusters

