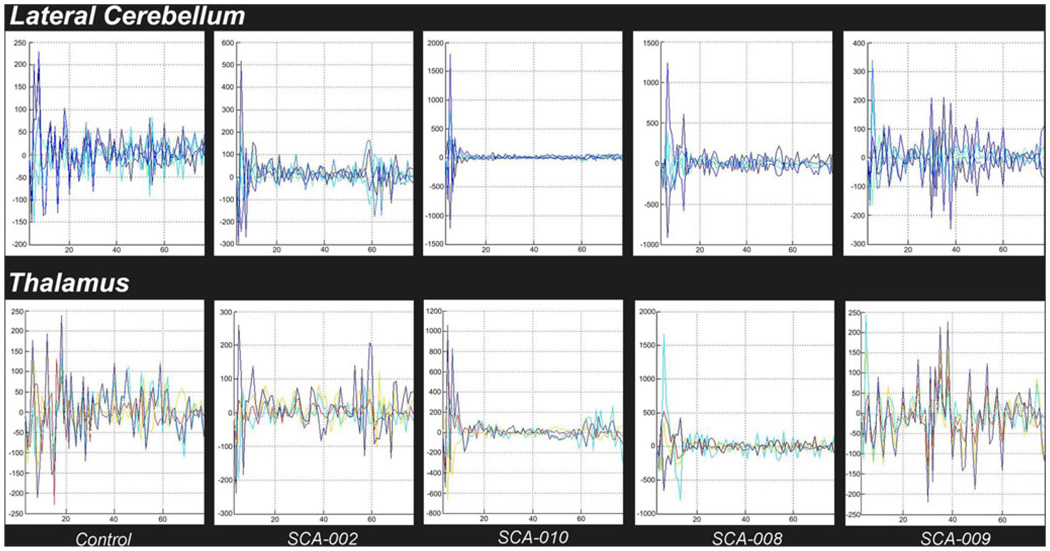
Fig. 7.
Graphical depiction of spectral analysis with FFT. Upper row: frequency distribution for clustered time series in the lateral cerebellum. Lower row: frequency distribution for clustered time series in contralateral thalamus. The first images on both rows represent the spectrum of a (typical) control case. Note the shift to the left in the distribution of frequencies for the SCA1 cases (SCA-002, 008, and 010) but not for the presymptomatic SCA-009 case. The shift seems to appear earlier in lateral cerebellum with respect to thalamus

