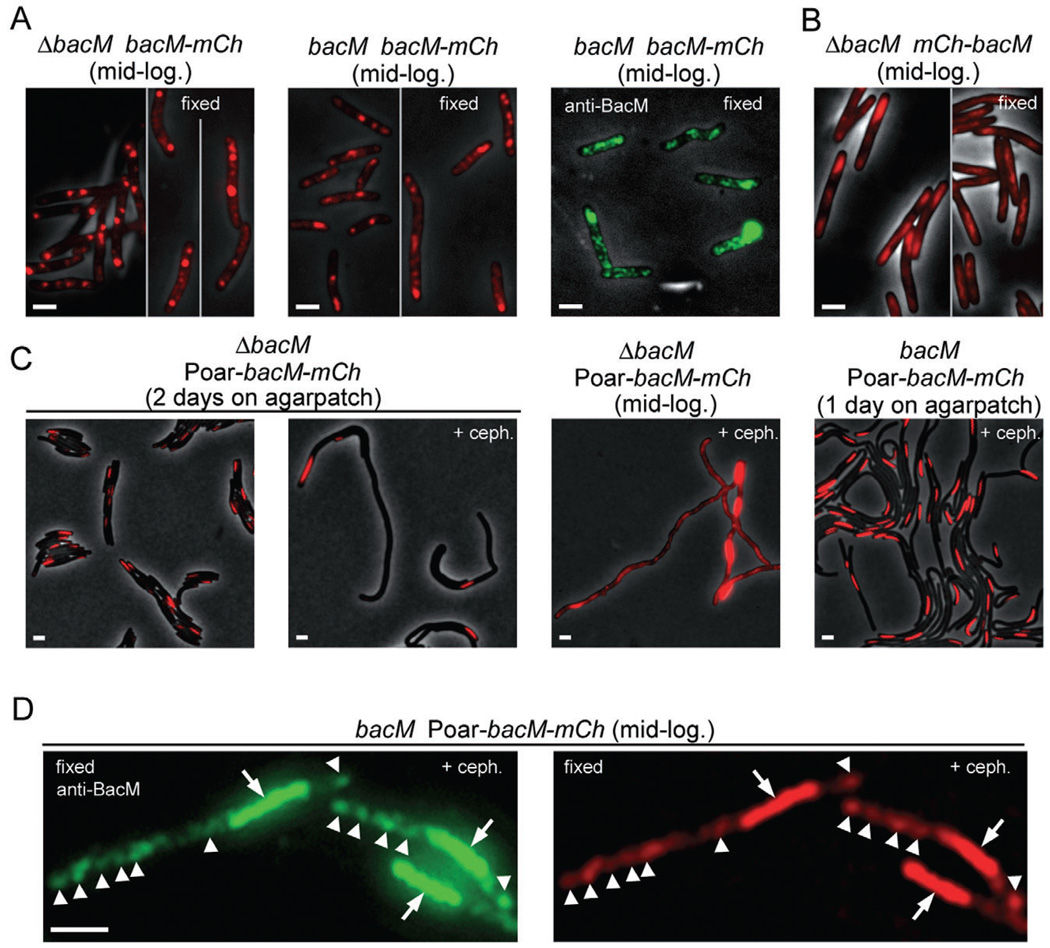
Fig. 5.
Fluorescence microscopy of M. xanthus cells which produce a protein fusion of BacM and mCherry. Relevant genotypes are listed. Red, fluorescence from mCherry; green, immunofluorescence after fixation and incubation with anti-BacM and secondary antibody. Visibility of black cells on grey background results from overlay of the phase-contrast image. Cells were visualized after harvesting from CTT cultures at mid-logarithmic growth phase (mid-log.), or directly on thin agar patches after growing there for 1–2 days. Growth was optionally in the presence of 100 µM cephalexin (+ceph.); cells were fixed when indicated.
A. Cells of strains EH358 and EH351, which express bacM–mCherry from the endogenous promoter in the absence or presence of native BacM respectively.
B. Cells of strain MT299, which express mCherry–BacM (Kühn et al., 2010). Regions in these cells that are devoid of mCherry signal colocalize with DNA stain, as shown in Fig. S8A.
C. Cells of strains EH364 and EH362, which express bacM–mCherry from the oar promoter (Poar) in the absence or presence of endogenous BacM respectively. Longer exposure of four cells at mid-logarithmic growth phase reveals one screw per cell plus additional unevenly distributed fluorescence throughout the cells.
D. Cells of strain EH362, harvested after cephalexin treatment, fixed, and incubated with anti-BacM and secondary antibody. Comparison of immuno- and mCherry-fluorescence shows colocalization of screws (arrows), and additionally of regions of weaker fluorescence throughout the cells (white arrowheads point to most intense signals in these regions for easier comparison of the images). Bars represent 2 µm.

