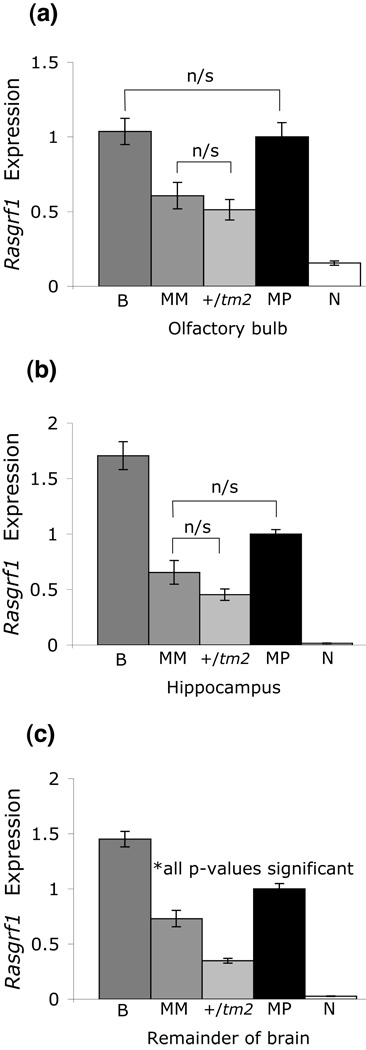
Figure 2. Rasgrf1 transcript quantification in P8 brain regions.
Rasgrf1 transcript from P8 neonates was quantified in (a) olfactory bulb, (b) hippocampus, and (c) the remainder of the brain (ROB; see Methods for details). Data were normalized to 18S rRNA levels and then further normalized to the Rasgrf1 expression level of the wildtype (MP) genotype. Except for those pairs depicted as nonsignificant (n/s), all pairwise comparisons were significantly different (p < 0.005, Bonferroni-corrected for ten multiple comparisons; Tables S1–S3). Note that higher Rasgrf1 expression levels tend to correspond to genotypes that are the best performers in the learned odor preference test, and that olfactory bulb expression patterns exhibit the best correlation with behavioral performance. Error bars indicate standard deviations.

