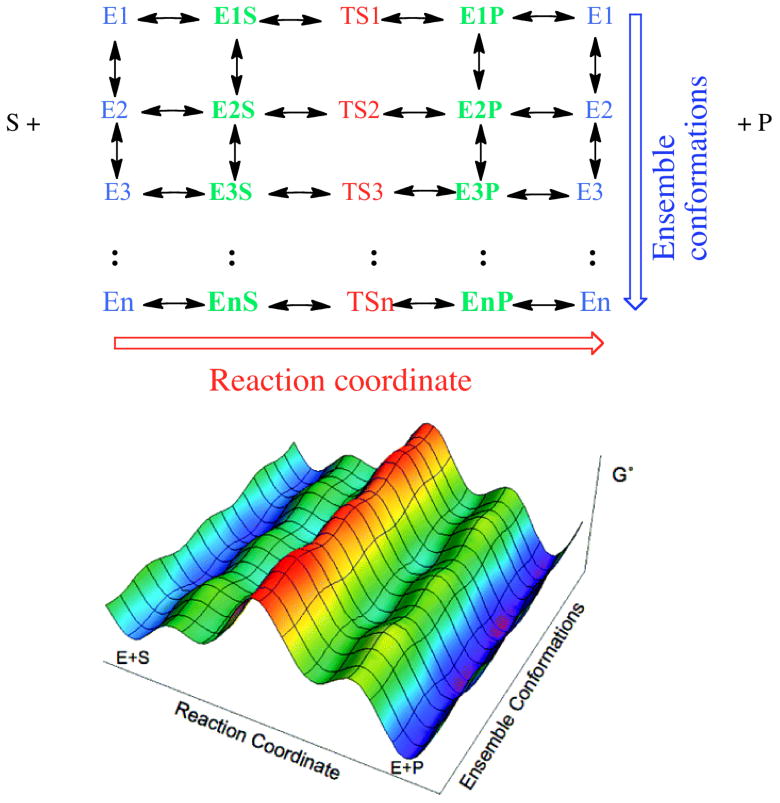
Figure 1.

Top: Two-dimensional matrix of enzyme states reflecting ligand free forms (blue) on the left (E1 through EN), substrate complexes (green) with the corresponding states (E1S through ENS), Transition state complexes (red, TS1 through TSN), and product complexes (blue, E1P through ENP) for each state, with return to the initial ensemble of ligand free states. Note, in our model the transition state are not connected via arrows – we do not imply conformation rearrangement at the transition state ‘ridge’ (red). The multiple conformations present along this ridge are separated by significant barriers. Bottom: A three dimensional free energy (G′) landscape representation of the system, when the catalytic transition states (TS) are rate limiting, color coded to as the matrix above. The lower free energy surface is adapted from reference 13.
