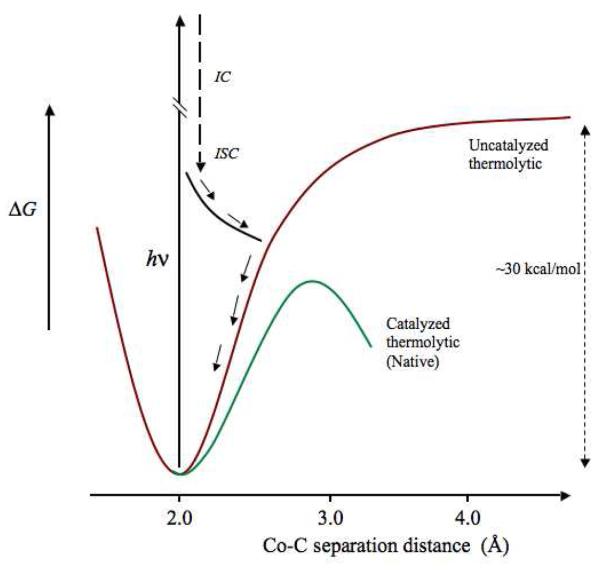
Figure 8.
Free energy curves for Co-C bond cleavage that depict the uncatalyzed thermolytic and native catalyzed thermolytic conditions, and representative trajectory of the cob(II)alamin-5′-deoxyadenosyl radical pair photoproduct, in EAL. The uncatalyzed thermolytic curve is based on calculated energy curves for Co-C bond cleavage for AdoCbl in solution and in proteins,42-44 and the native catalyzed thermolytic curve is based on the limit on the maximum of the free energy barrier of −15 kcal/mol.21 The representative photoproduct trajectory is based on calculations.41

