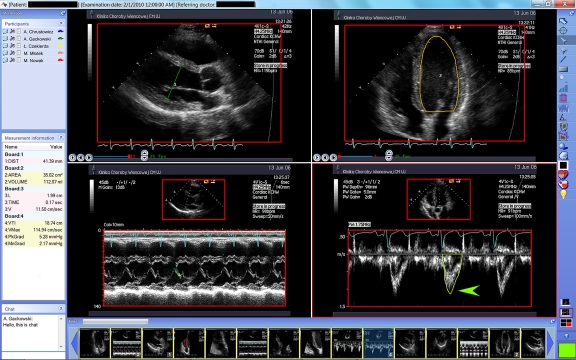
Fig 3.
Sample teleconsultation screen. Left upper panel: the names of teleconference participants. Right bar: visual and measurement tools. Central panel: echocardiographic images displayed in quad-screen format (single screen format is also available). Upper images are in this case 2D video clips (start, stop, and frame rate controls are visible). Lower images show M-mode and spectral Doppler images. Red rectangles represent automatically calibrated sectors of DICOM images. Physicians can show selected aspects of the study by color arrows and are able to make freehand drawings. All types of echocardiographic measurements can be performed with the results displayed in the left panel. Left lower panel is a chat window. Lower panel shows thumbnails of the available images that can be placed in the main panel.

