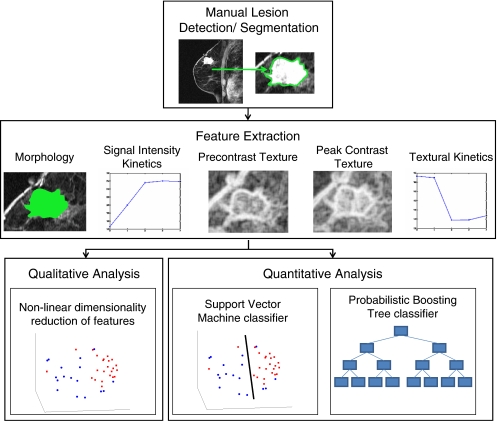
Fig 2.
Flowchart illustrating the steps comprising the methodology presented in this paper. Following manual lesion detection and segmentation, four different feature classes are extracted (morphological, signal intensity kinetics, precontrast texture, and peak contrast texture) to compare against textural kinetics. Quantitative evaluation of the five feature classes is done via support vector machine and probabilistic boosting tree classifier accuracy, while graph embedding is used for qualitative evaluation.

