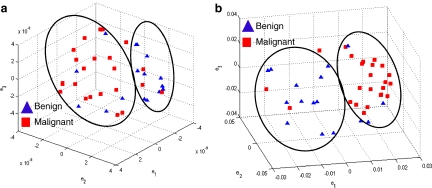
Fig 4.
Embedding plots obtained by plotting the three dominant graph embedding vectors  for (a) signal intensity kinetics and (b) gradient kinetics in the X-direction. Note that the increased separation of benign (blue) and malignant (red) lesions for the textural kinetics feature (b) compared to signal intensity kinetics (a).

