Fig 5.
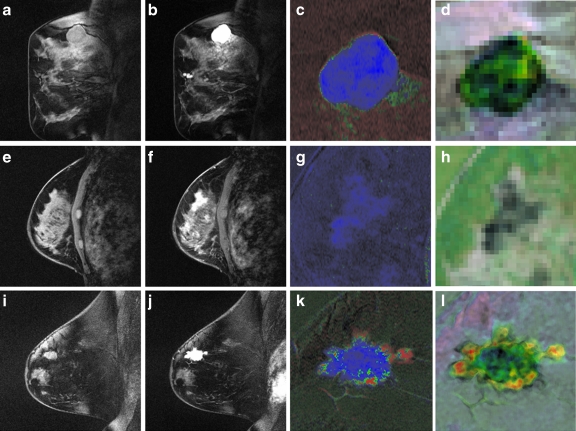
Examples of the contrast enhancement patterns associated with (a–d) a benign fibroadenoma, (e–h) a benign sclerosing adenosis, and (i–l) a malignant invasive ductal carcinoma. a, e, i Precontrast image. b, f, j Postcontrast image at peak enhancement. c, g, k 3TP maps corresponding to the studies in a, e, and i. d, h, l Textural kinetic maps for the median filter feature. The third and fourth columns are magnified to illustrate details of the lesion. Note that d, h, and l appear to capture heterogeneity of lesion enhancement (highest in l).

