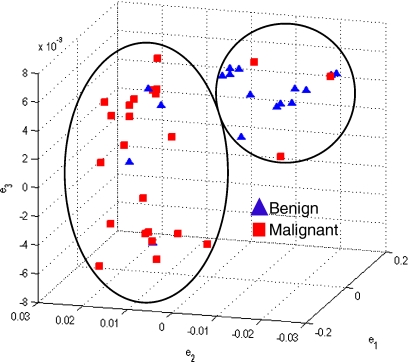
Fig 8.
Embedding plot obtained by plotting the three dominant graph embedding vectors  for the combination of the morphology feature, smoothness, with the first-order textural kinetic feature, X-gradient. Note that the lesion classes appear to be better separated compared to Fig. 4.

