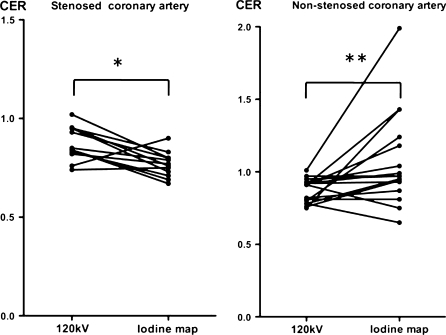
Fig. 2.
Comparison of the coronary enhancement ratio (CER) of stenotic and non-stenotic arteries on 120 kV images and an iodine map under adenosine stress. In the case of stenotic coronary arteries (left), CER was significantly less on the iodine map than on the 120 kV images (* P < 0.005). In the case of non-stenotic coronary arteries (right), CER was significantly greater on the iodine map than on the 120 kV images (** P = 0.02)

