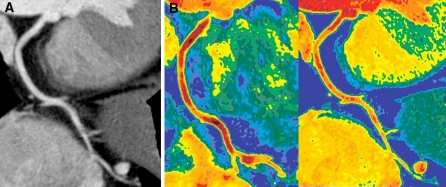
Fig. 6.
Coronary images during adenosine stress in a 71-year-old female with normal coronary arteries. a Curved multiplanar reformatted image at 120 kV shows no stenosis and no plaque in the right coronary artery. b Colored coronary images demonstrate higher attenuation within the coronary artery on the iodine map (right) than on the 120 kV image (left). The average attenuation for the right coronary artery was 287 HU on the 120 kV images and 444 HU on the iodine map. The CER value was 0.8 on the 120 kV images and 1.24 on the iodine map. The color scale uses a gradient of warm colors, classified into six steps by Hounsfield units (HU) as follows: 150–200, 201–250, 251–300, 301–350, 351–400, 401–450 HU. Yellow indicates the lowest attenuation and dark red indicates the highest

