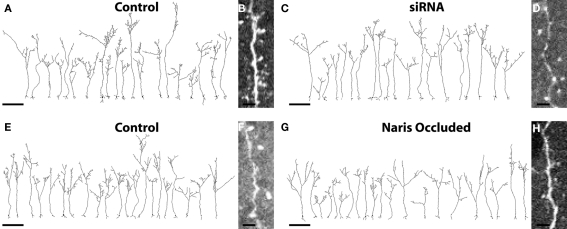
Figure 2.
Complete cellular reconstructions of randomly selected EGFP+ ABNs. (A,C) Group 1 cells; four animals, five cells per hemisphere, n = 20 per condition. Scale bar, 100 μm. (B,D) Raw image of dendrite and spines taken from image stacks of control and siRNA cells respectively. Scale bar, 5 μm. (E,G) Group 2 cells; three animals, seven cells per hemisphere, n = 21 per condition. Scale bar, 100 μm. (F,H) Raw image of dendrite and spines taken from image stacks of control and naris-occluded cells respectively. Scale bar, 5 μm.

