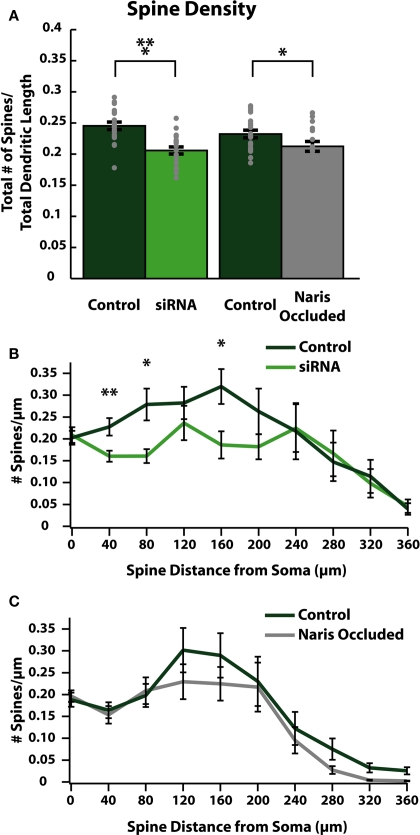
Figure 4.
Reducing activity decreases spine densities in specific regions of ABNs. (A) Spine density per cell (gray dots) and group means (bars with SE). Spine density calculated as total spines per cell divided by total apical dendrite length. Both siRNA knock-down and naris-occluded cells show significant overall reductions in spine (control/siRNA: p < 0.001, n = 20; control/NO: p = 0.039, n = 21), without significant difference in total apical dendritic length (see Tables 1 and 2). (B,C) Spine density plotted as total number of spines divided by total apical dendrite length in 40 μm bins vs. distance along apical dendrite path with SE. siRNA knock-down cells (B) show significant decreases in spine density in proximal and intermediate regions of the dendrite (at 40 μm: p < 0.01; at 80 μm: p < 0.05; at 160 μm: p < 0.05; n = 20). No significant differences were observed in naris-occluded cells (C).

