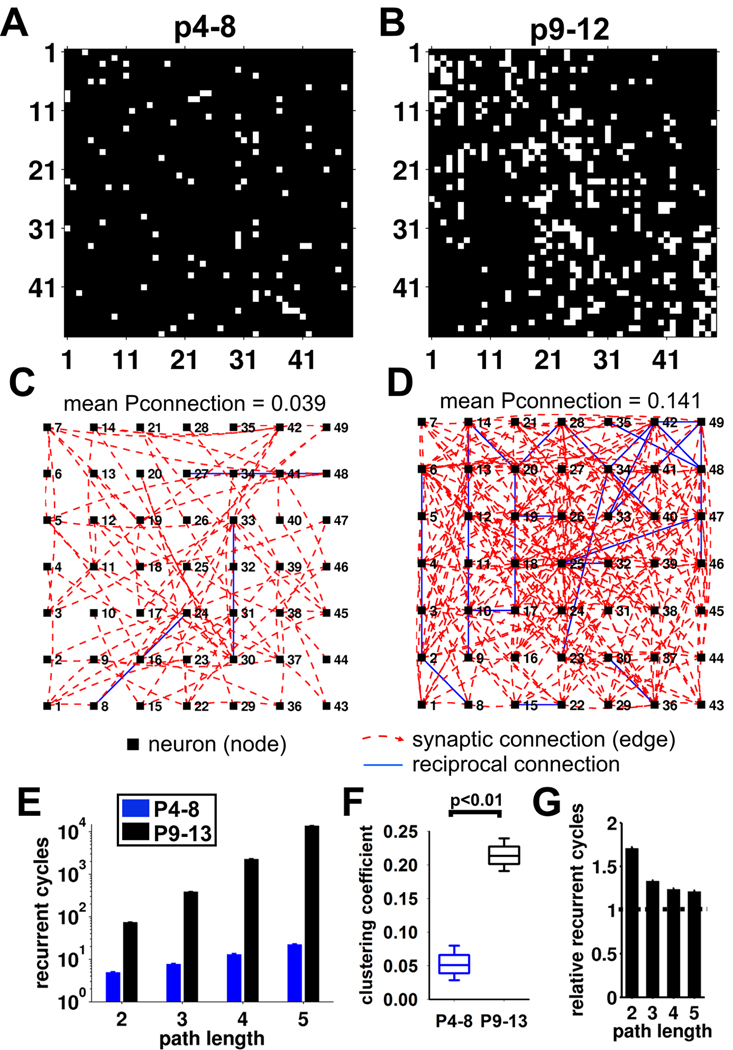
Figure 5. The developmental increase in connectivity is predicted to produce a highly recurrent local circuit.
(A&B) Example adjacency matrices for test (using the experimentally determined Pconnection-distance relationship) and matched random (same mean Pconnection but a random Pconnection-distance relationship) networks for (A) P4–8 and (B) P9–12. White pixels represent connected cells, black is not connected. (C&D) Network connection graphs for the adjacency matrices in A & B, respectively. Each node represents the spatial position of a neuron and synaptic connections are shown as dashed red lines (unidirectional – clockwise curve if the cell is presynaptic, anti-clockwise curve if the cell is postsynaptic) or blue (bidirectional – reciprocal). (E) Total number of recurrent cycles for path lengths from 2–5 in modeled networks generated from P4–8 and P9–12 experimental data (for each path length, p<0.001, P4–8 vs P9–12). (F) Box plot showing clustering coefficient from modeled P4–8 and P9–13 networks (median ± 95% confidence limits, box shows 25/75 percentiles). (G) Ratio of the number of recurrent cycles of path lengths 2–5 between experimental and matched random networks for P9–12 (mean ± sem).

