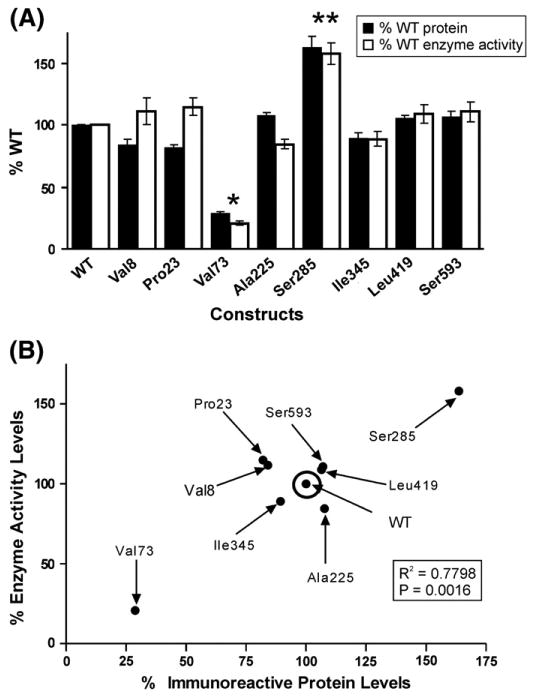
Fig. 2.

MME functional genomics. (A) Levels of MME immunoreactive protein and allozyme enzyme activity as a percentage of wild type (WT). Each bar represents the average of six independent transfections (mean±SE). All values are corrected for transfection efficiency. *p<0.001 and **p<0.05 when compared with the WT value. (B) Correlation between average levels of MME immunoreactive protein and enzyme activity.
