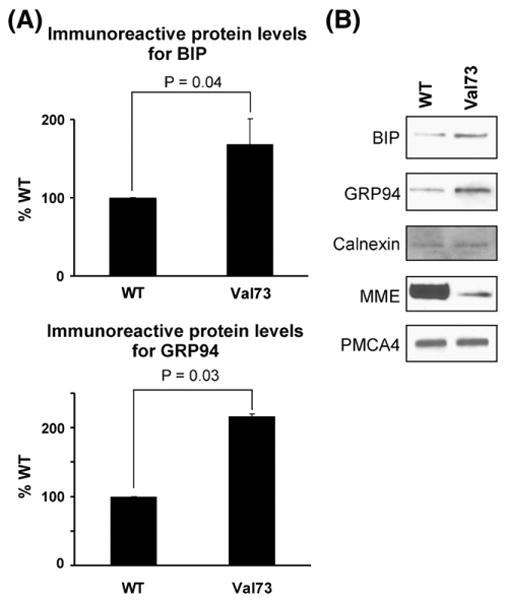
Fig. 5.

MME degradation and chaperone proteins. (A) The bar graph shows levels of BiP and GRP94, chaperone proteins in the endoplasmic reticulum for COS-1 cell lysates after transfection with WT and Val73 expression constructs. Protein levels are shown as a percentage of that seen after WT transfection. Each bar represents the average of 6 independent transfections (mean±SE). (B) Representative Western blot analysis for WT and Val73 COS-1 cell lysates showing BiP and GRP94, with the membrane proteins Calnexin and PMCA4 ATPase stained as “standards”.
