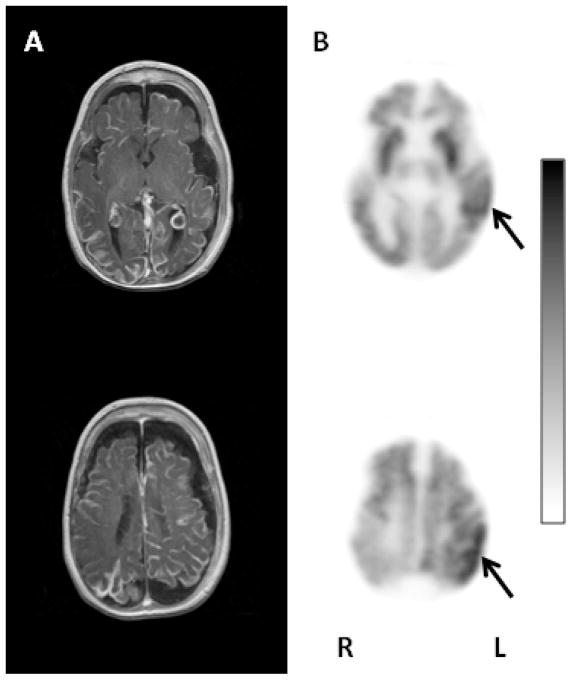
Figure 1.
Representative axial images of the T1 weighted postgadolinium MRI (A) and glucose PET images (B) of patient # 4. This child had poor seizure control, severe developmental impairment and left hemiparesis at the time of the PET scanning. The MRI showed severe bilateral brain atrophy with extensive bihemispheric leptomeningeal angiomatosis and bilateral enlargement of the choroid plexus. The glucose metabolism of the entire right hemisphere was decreased. Additionally, the left frontal and occipital cortex was also hypometabolic, and only the temporal and parietal cortex showed preserved glucose metabolism on the left side (solid arrows). L: left; R: right.

