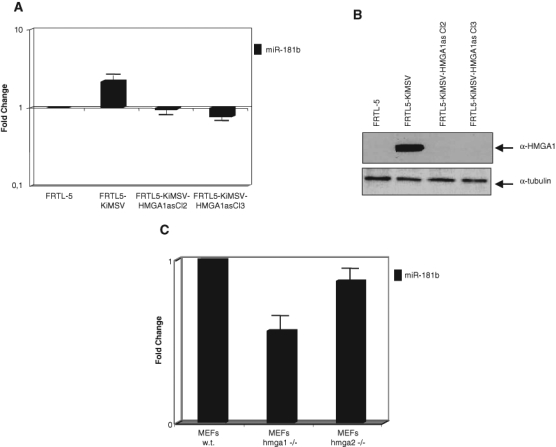
Figure 2.

Analysis of miR-181b and miR-181a expression in cells expressing or not the HMGA1 protein. (A) MirVana qRT-PCR analysis of miR-181b expression in normal and retrovirally infected cells. Relative miR-181b levels were normalized to the U6 RNA using the 2−ΔCt method,25 and the fold-change values indicate the relative change in expression levels between normal and retrovirally infected rat thyroid cells, assuming that the value of normal cells is equal to 1. The results are reported as the mean of expression values; error bars indicate standard deviation (mean ± SD); n = 3. (B) Western blot analysis of hmga1 expression in normal and retrovirally infected cells. The Western blot was incubated with antibodies specific for the HMGA1 protein. As control for equal loading, the same blot was incubated with antibodies against α-tubulin. (C) Correlation between hmga1 and miR-181b in murine embryonic fibroblasts (MEFs). MirVana qRT-PCR analysis of miR-181b expression in MEFs null for hmga1 (bar 2) and hmga2 (bar 3). The relative amount of the RNA was normalized to the U6 RNA using the 2−ΔCt method,25 and the fold-change values indicate the relative change in expression levels between the hmga1−/− or hmga2−/− and wild-type cells, assuming that the value of wild-type MEFs is equal to 1. The results are reported as the mean of the expression values, with error bars indicating standard deviation (mean ± SD); n = 3.
