
Figure 4.
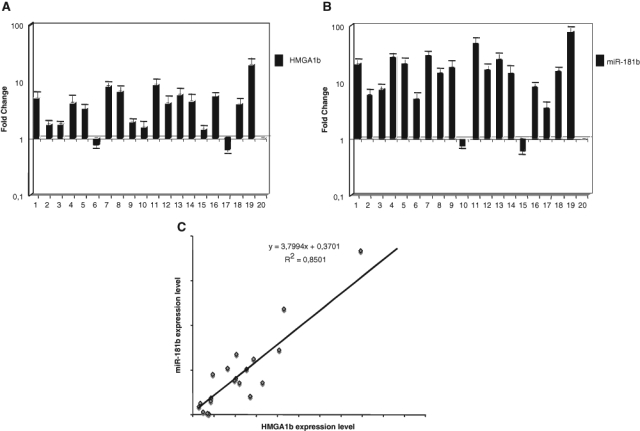
miR-181b expression directly correlates with the expression of the HMGA1 gene in human breast carcinoma tissues. (A) qRT-PCR analysis of HMGA1b mRNA expression. The fold-change values indicate the relative change in the expression levels between normal and carcinoma samples, assuming that the value of each matched normal breast tissue is equal to 1. (B) MirVana qRT-PCR analysis of miR-181b expression in the samples shown in panel A. (C) Plot of the data generated from panels A and B defines the linear relationship between miR-181b and HMGA1b expression by measuring the Pearson coefficient correlation reported in the figure.