
Figure 6.
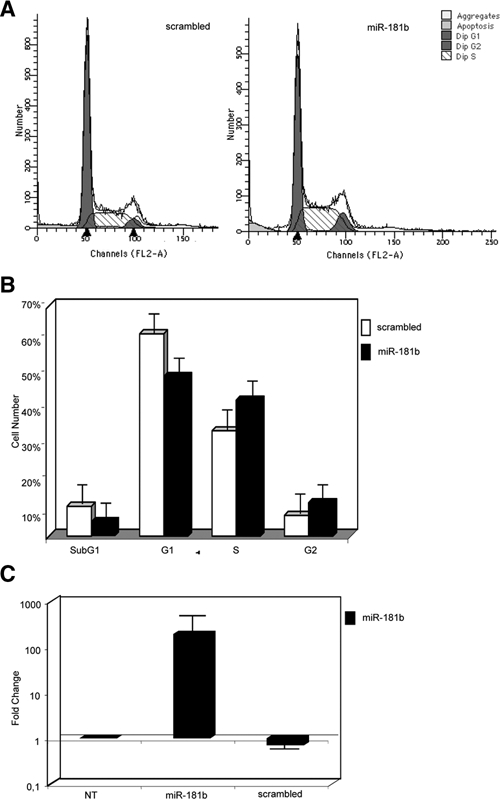
miR-181b expression increases the cell population in S phase of the cell cycle in MDA-MB435s cells. (A and B) Cell-cycle distribution of MDA-MB435s cells, in the exponential phase of growth, transfected with Pre-miR-181b precursor molecules or scrambled control. Forty-eight hours after transfection, the cells were fixed in ethanol and stained with propidium iodide. (A) Primary flow cytometry histograms. (B) Quantification of the cell population in different cell cycle phases with the CELL-FIT program. The error bars represent the standard deviation of the mean of 3 independent experiments. (C) MirVana qRT-PCR analysis of miR-181b expression. The relative amount of miR-181b was normalized to the U6 RNA using the 2−ΔCt method,25 and the fold-change values indicate the relative change in expression levels between the cells transfected with Pre-miR-181b or scrambled oligonucleotide versus untransfected cells (NT), assuming that the value of the NT sample is equal to 1.