
Figure 7.
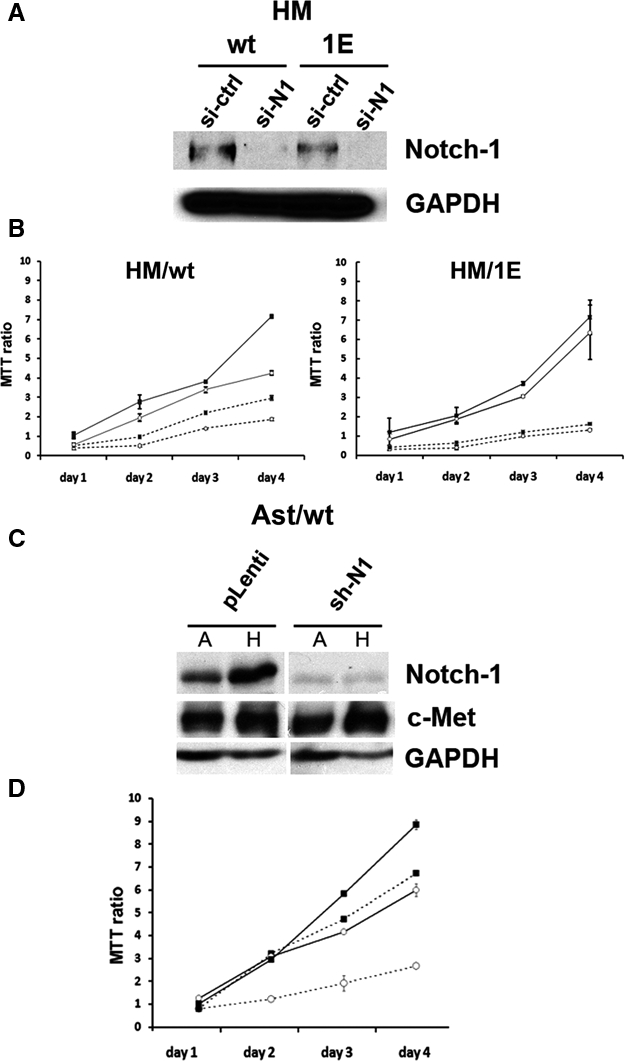
Role of Notch-1 in SV40-mediated transformation of HM and Ast. (A) Notch-1 silencing in HM infected with wtSV40 and 1ESV40. Western blotting was performed 48 hours after transfection with Notch-1 siRNA (si-N1) or with “scramble” control oligonucleotide (si-ctrl). Note the reduction of Notch-1 expression in cells transfected with si-N1. GAPDH was used as the loading control. (B) Cell viability was measured by the MTT assay in triplicate. HM, 72 hours after infection with 1ESV40 and wtSV40, were analyzed 24, 48, 72, and 96 hours after transfection with siRNA oligonucleotides. Solid lines (━) = attached growth; dotted lines (- - -) = growth on polyHema; black square (■) = cells transfected with “scramble” control siRNA; white circle (○) = cells transfected with Notch-1 siRNA. (C) Immunoblotting analysis performed on day 7 after lentivirus transduction, in cells grown in polyHEMA (H) or attached (A). Specific knockdown of Notch-1 in Ast/wt cells is shown, as c-Met expression (control) is not affected. (D) Cell viability (MTT) assay was done in triplicate, as in B, upon Notch-1 knockdown. Ast/wt cells showed decrease of anchorage-independent growth and proliferation. Solid lines (━) = attached growth; dotted lines (- - -) = growth on polyHema; black square (■) = cells transduced by control p-Lenti vector; white circle (○) = cells transduced with Notch-1 shRNA.