Figure 3.

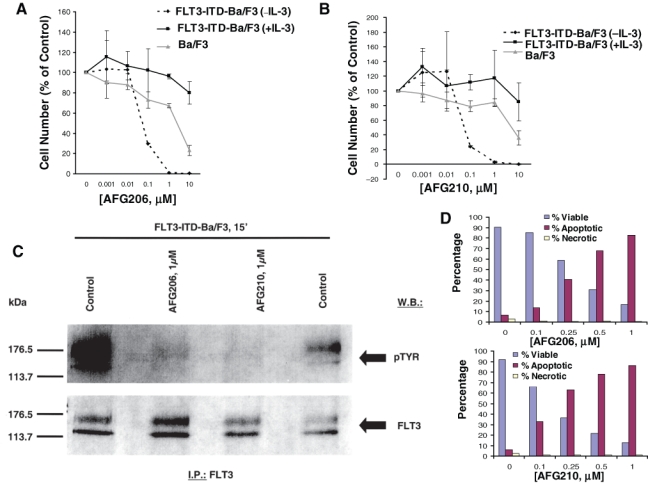
Inhibition of mutant FLT3 kinase by first-generation type II FLT3 inhibitors, AFG206 and AFG210. Approximately 3-day treatment of Ba/F3 cells (+ IL-3) and FLT3-ITD-Ba/F3 cells (+/− IL-3) with AFG206 (A) and AFG210 (B). (C) FLT3 I.P./Western. (D) Induction of apoptosis following an approximately 3-day treatment of FLT3-ITD-Ba/F3 cells with AFG206 (upper panel) and AFG210 (lower panel). Staining cells simultaneously with FITC-Annexin V and the nonvital dye propidium iodide allows (bivariate analysis) the discrimination of intact cells (FITC–PI–), early apoptotic cells (FITC+PI–), and late apoptotic or necrotic cells (FITC+PI+). Results shown in the bar graph are derived from cytograms in which early apoptotic cells are in the lower right quadrant that are Annexin V positive and PI negative; late apoptotic or necrotic cells are in the upper right quadrant that are PI positive and Annexin V positive; live cells in the lower left quadrant are negative for both fluorescent probes. Necrotic cells show up in the upper left-hand quadrant.
