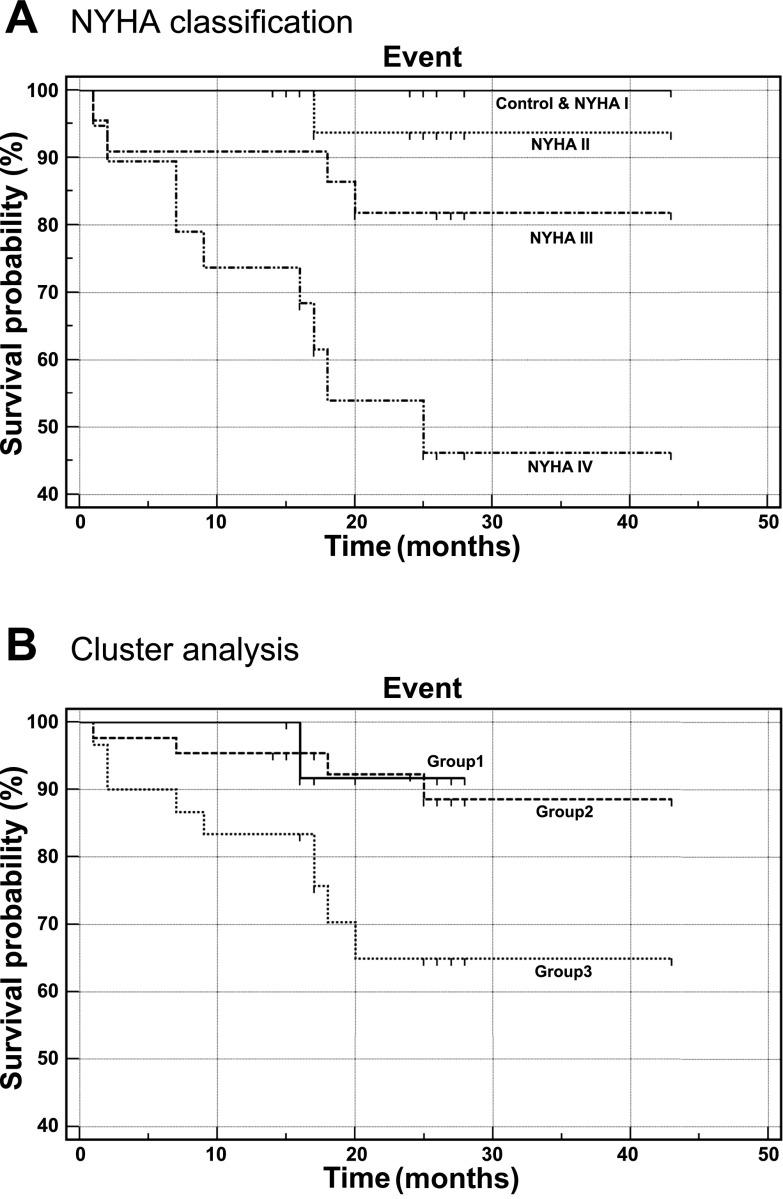
Fig. 3.
Kaplan Meier survival plots of the study subjects. A: study subjects were classified by NYHA classification. B: study subjects were classified by the cluster analysis of the 10 mortality genes involved in T cell receptor signaling: the solid plot indicates group 1; the dashed plot indicates group 2; the dotted plot indicates group 3.

