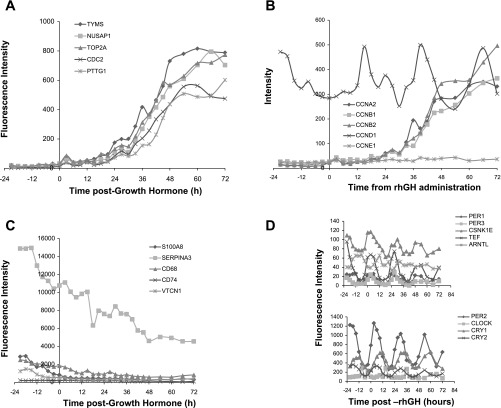
Fig. 5.
A: microarray expression (fluorescence intensity) of 5 (of 121) genes that increased in response to rhGH treatment. Data are the average from 5 subjects. TYMS, NUSAP1, TOP2A, CDC2, PTTG1 were among the most highly induced genes. B: microarray expression data on cyclin genes CCNA2, CCNB1, CCNB2, CCND1, and CCNE1. Of these cyclins, CCNA2, CCNB1, CCNB2, and CCNE1 were induced by rhGH treatment, while CCND1 expression was not increased further. C: microarray expression (fluorescence intensity) of 5 (of 21) genes downregulated in response to rhGH treatment - S100A8, SERPINA3, CD68, CD74, VTCN1. D: core circadian clock gene expression in the mammary epithelial compartment before and after rhGH treatment. Circadian expression was not changed by rhGH administration. Values are the means at each time point for the 5 subjects. Note different scales on the y-axis.

