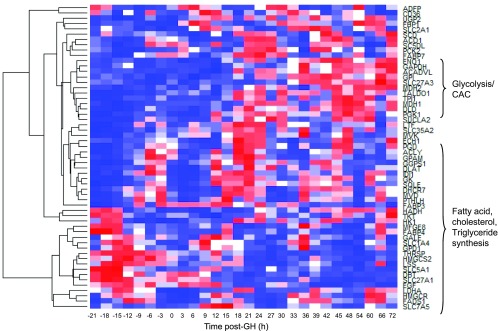
Fig. 6.
Milk synthesis genes significantly (P < 0.05) regulated as analyzed by EDGE time-course analysis. Hierarchical clustering, correlation (distance = 1 − p) generated on the EDGE software. Genes involved in glycolysis and citric acid cycle (CAC) were more highly expressed toward the end of the study. Genes involved in the synthesis of fatty acid, cholesterol, and triglycerides exhibited a circadian pattern.

