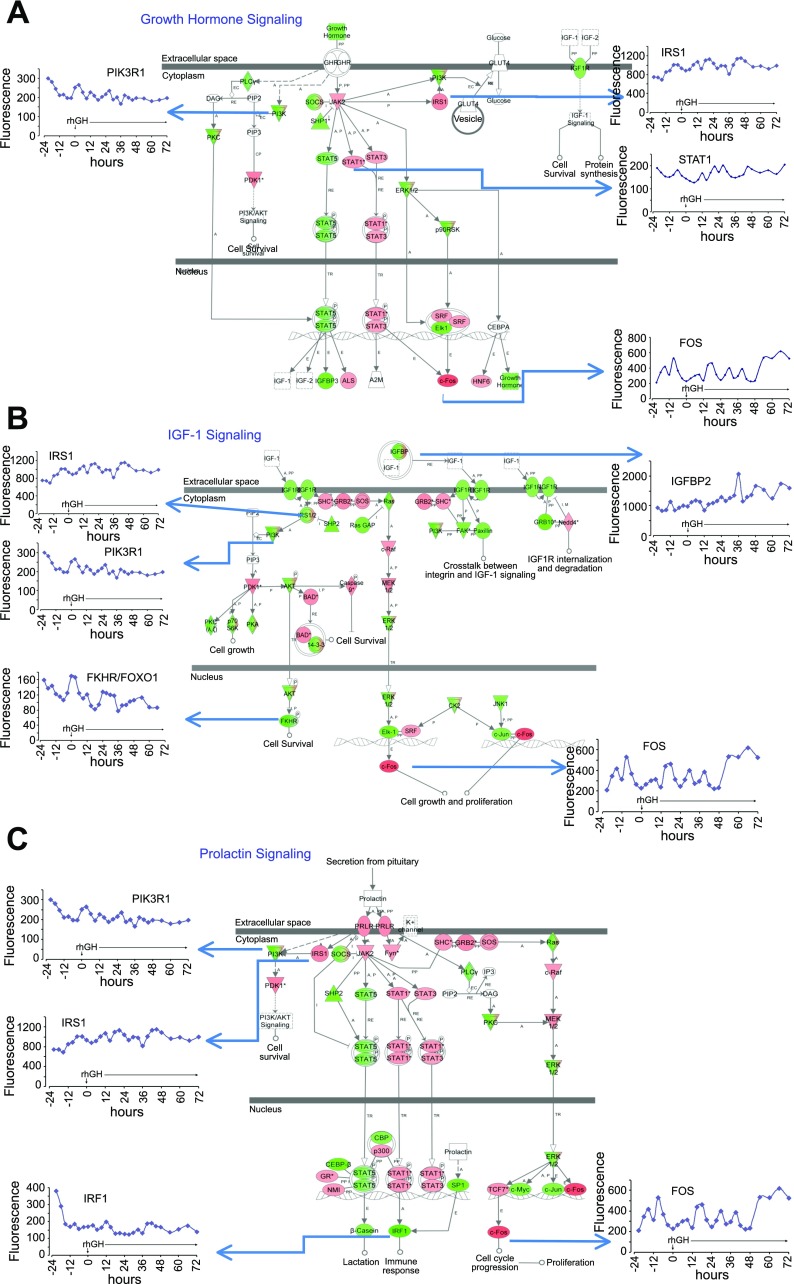
Fig. 7.
A: growth hormone signaling in the mammary epithelial compartment (MEC). Figure is taken from Ingenuity Pathways. Note that GLUT4 is known not to be expressed in the mammary epithelium and is not expressed in our MEC samples. Colored nodes indicate genes that were expressed and detected in the microarray. Green indicates lower expression, and red indicates higher expression at the end of the study compared with baseline, respectively. Inset graphs [Fluorescence (y-axis) vs. time p-rhGH (x-axis)] are genes whose expressions were altered after rhGH administration. B: insulin-like growth factor (IGF-1) Signaling in the MEC. Figure is taken from Ingenuity Pathways. Colored nodes indicate genes that were expressed and detected in the microarray. Green indicates lower expression and Red indicates higher expression at the end of the study compared with baseline, respectively. Inset graphs [Fluorescence (y-axis) vs. time p-rhGH (x-axis)] are genes whose expressions were altered after rhGH administration. C: prolactin signaling in the MEC. Figure is taken from Ingenuity Pathways. Colored nodes indicate genes that were expressed and detected in the microarray. Green indicates lower expression and Red indicates higher expression at the end of the study compared with baseline, respectively. Inset graphs [Fluorescence (y-axis) vs. time p-rhGH (x-axis)] are genes whose expressions were altered after rhGH administration.

