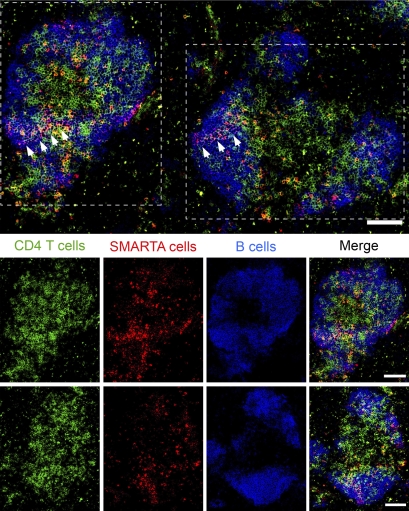
Figure 2.
Virus-specific CD4 T cells traffic to B cell areas during persistent viral infection. Day 30 LCMV-Cl 13–infected spleen sections were stained with antibodies to CD4 (green), CD45.1 (SMARTA cells; red), and B220 (B cells; blue). The top row is a merged image illustrating the location of all the three cell types. The white arrows in the image indicate SMARTA cells within B cell areas. The bottom two rows depict the two follicular-like structures outlined with white dotted lines in the top image. The last row depicting a follicular-like structure is rotated 90 degrees relative to the top image. The first column represents total CD4 T cells, the second column represents virus-specific SMARTA cells, the third column represents total B cells, and the last column is a merged image. The scale bar within each image corresponds to 100 µm. The image is representative of 5–13 different CD4 T cells cell areas per spleen and 5 individual spleens.

