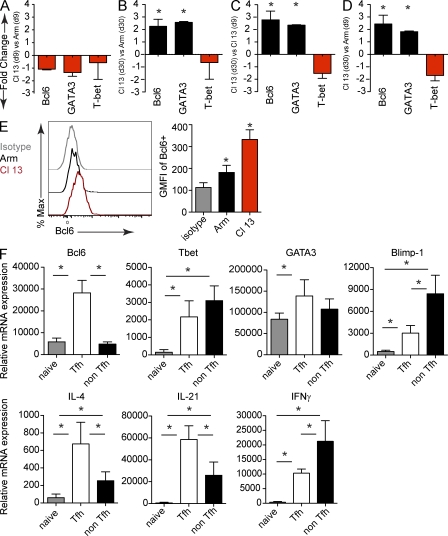
Figure 4.
Persistent viral infection induces Tfh transcriptional master regulators. SMARTA cells were FACS isolated from splenocytes on day 9 and 30 after LCMV-Arm or Cl 13 infection. mRNA expression was analyzed by quantitative RT-PCR. The results are presented as mean fold change in expression ± SD between SMARTA cells isolated from (A) LCMV-Cl 13 versus LCMV-Arm on day 9 after infection, (B) LCMV-Cl 13 versus LCMV-Arm on day 30 after infection, (C) LCMV-Cl 13 on day 30 versus day 9 after infection, or (D) LCMV-Cl 13 on day 30 versus LCMV-Arm on day 9 after infection. Data are representative of four mice per group and two individual experiments (*, P < 0.05). (E) The histogram illustrates Bcl6 expression in SMARTA cells on day 30 after LCMV-Arm (black) and Cl 13 infection (red). The gray line represents the isotype control. The bar graph on the right depicts the GMFI ± SD of Bcl6 in SMARTA cells. Data are representative of four to five mice per group and three separate experiments (*, P < 0.05). (F) mRNA expression was analyzed by quantitative RT-PCR from naive virus-specific CD4 T cells (SMARTA), splenic Tfh (CD4+, Ly5.1+, CXCR5+), and non-Tfh (CD4+, Ly5.1+, CXCR5) SMARTA cells sorted 30 d after LCMV-Cl 13 infection. The results are presented as the mean relative mRNA expression ± SD. Data are representative of four to five groups (each group consisting of sorted cells from five to six mice) and two to three separate experiments. Note, IL-4 data are presented from one experiment containing five groups (each group consisting of sorted cells from five mice; *, P < 0.05).

