Figure 5.
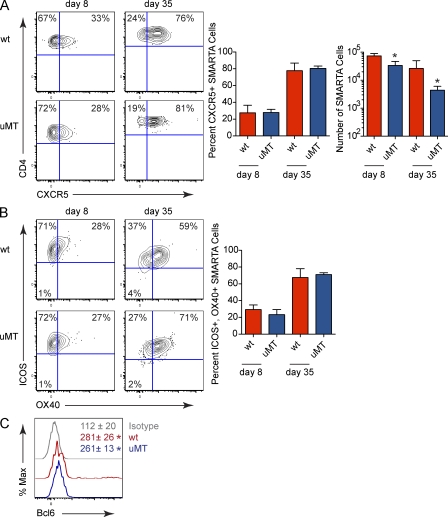
B cell–independent Tfh development during persistent viral infection. (A) The flow plots illustrate CXCR5 expression on SMARTA cells from LCMV-Cl 13–infected WT or μMT mice. The left bar graphs indicate the percentage ± SD of CXCR5 + SMARTA cells and the right bar graph depicts the absolute number ± SD of SMARTA cells. (B) The flow plots show ICOS and OX40 expression on SMARTA cells from LCMV-Cl 13–infected WT or μMT mice. Bar graphs indicate the percentage ± SD of ICOS+, OX40+ SMARTA cells. (C) The histogram depicts Bcl6 expression within SMARTA cells isolated from WT (red) and μMT (blue) mice 30 d after LCMV-Cl 13 infection. The gray line represents the isotype control. Numbers indicate the mean GMFI ± SD of Bcl6. Data are representative of three to four mice per group and three individual experiments (*, P < 0.05).

