Figure 7.
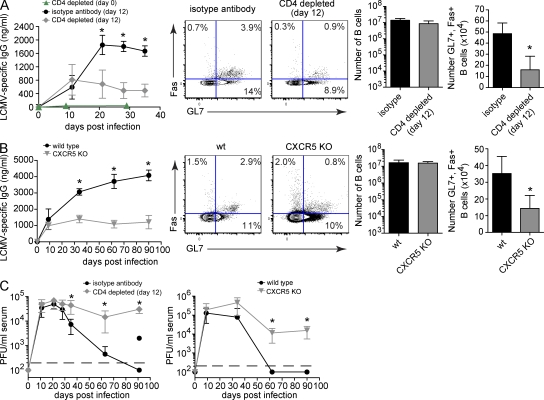
Tfh cell development is required to sustain LCMV-specific B cell responses during persistent viral infection. (A) Antiviral B cell responses during LCMV-Cl 13 infection in isotype antibody control treated mice versus day 0 or 12 CD4-depleted WT mice. The line graph depicts the serum concentration (nanogram/milliliter) ± SD of LCMV-specific IgG produced by mice injected with isotype control antibody (black circles), or mice depleted of CD4 T cells on day 0 (green triangles) or day 12 (gray diamonds) on the indicated day after infection. Flow plots illustrate the frequency of GC B cells (GL7+, Fas+ B cells) on day thirty-five after infection. The bar graphs indicate the number ± SD of total B cells (left bar graph) and GC B cells (right bar graph) during persistent LCMV-Cl 13 infection. (B) Antiviral B cell responses during LCMV-Cl 13 infection in WT (black, circles) versus CXCR5 KO mice (gray, inverted triangles). The same analyses were performed as described in A. (C) Serum viral titers after LCMV-Cl 13 infection of isotype antibody control (black, circles) versus day 12 CD4-depleted (gray, diamonds) mice (left) or WT (black, circles) versus CXCR5 KO (gray, inverted triangles) mice (right). Data are expressed as PFU per milliliter serum ± SD. The black, dashed line indicates the lower limit of detection (200 PFU/ml). Data are representative of three to six mice per group and three individual experiments (*, P < 0.05).

