Figure 8.
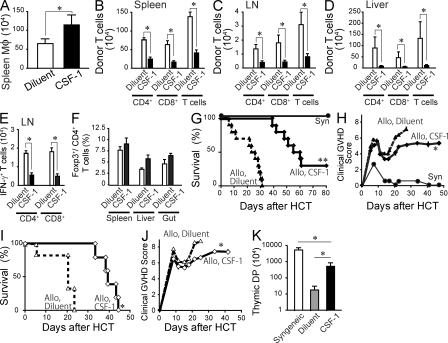
CSF-1 administration reduces donor T cell expansion and GVHD severity. (A) C57BL/6 mice were injected i.p. with 106 U human CSF-1 (black bar, n = 11) or diluent (white bar, n = 11) daily for 5 d and transplanted with 5 × 10⁶ splenocytes and 5 × 10⁶ BM cells 1 d after the last injection. Splenic macrophages were enumerated 24 h after the transplant and shown as mean ± SEM. Data from three separate experiments were combined. (B–F) C57BL/6 mice were treated with CSF-1 (black bar, n = 12) or diluent (white bar, n = 12) and transplanted as in A. Bar graphs show the number of donor T cells in the spleen (B), mesenteric LN (C), and liver (D) and the number of IFN-γ–producing T cells (E) and Foxp3+ T regulatory cells in the mesenteric LN (F) on day 6 after transplant. Data are shown as mean ± SEM. (G–K) C57BL/6 mice were treated with CSF-1 (diamonds, solid lines) or diluent (triangles, dashed lines) for 5 d and injected with 10 × 106 (G, H, and K, n = 10/group) or 20 × 106 (I and J, n = 5–6/group) splenocytes plus 5 × 10⁶ BM cells isolated from BALB/c donors 1 d after the last CSF-1 injection. As controls, recipient mice were reconstituted with syngeneic BM cells and splenocytes (G, filled circles, n = 3). Survival curves (G and I) and clinical GVHD scores (H and J) are shown. (K) The numbers of thymic CD4+ CD8+ double-positive cells from diluent-treated (gray bar) and CSF-1–treated (black bar) recipients were enumerated on day 22 and shown as mean ± SEM. As control, the data from syngeneic recipients (white bar, n = 3) were shown. Data were pooled from two independent experiments. *, P < 0. 05; *, P < 0.0001 versus diluent-treated controls

