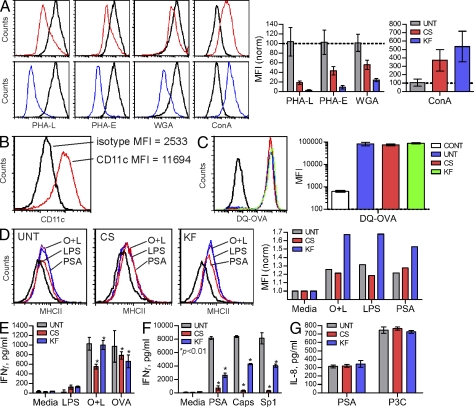
Figure 5.
Native complex N-glycans are required for PSA-driven T cell activation in vitro. (A) BMDCs were cultured in the presence or absence of CS (red) and KF (blue) for 3 d, and then analyzed by PHA-L, PHA-E, WGA, and Con A lectin flow cytometry to detect N-glycans. Representative histograms and n = 4 MFI analyses are shown. (B) BMDCs were cultured for 8 d, probed with CD11c mAb, and analyzed by flow cytometry to verify proper DC cell differentiation. Representative histogram is shown. (C) BMDCs were incubated with nonfluorescent intact DQ-OVA protein for 24 h to allow uptake and processing. Cells were then analyzed for fluorescence, which is indicative of endocytosis and cleavage to peptides. Representative histograms are shown. n = 4 for MFI analyses. (D) BMDC maturation upon exposure to antigen was measured by surface staining of MHCII 24 h after stimulation with OVA peptide and LPS (O+L), LPS alone, or PSA. Representative histograms shown. (E) BMDCs grown with and without CS and KF were pulsed with either DQ-OVA (OVA), OVAp+LPS (O+L), or LPS alone for 24 h, after which untreated fresh naive CD4+ T cells isolated from OT-II animals were added. n = 3 per condition, per antigen. (F) As with OVAp, BMDCs were grown with CS and KF and pulsed with PSA, Sp1, or B. fragilis capsule (Caps) for 24 h. Next, naive WT C57BL/6 CD4+ T cells were added to allow activation to occur. n = 3 per condition. (G) TLR2 activation by PSA, a necessary step in GlyAg-mediated T cell activation (Wang et al., 2006), and a control agonist Pam3Cysk4 (P3C) was measured in untreated (UNT), CS-treated, or KF-treated TLR2+ HEK293 cells. Bars represent background-subtracted values. n = 3 per condition. All bar graphs show the mean ± SEM.

