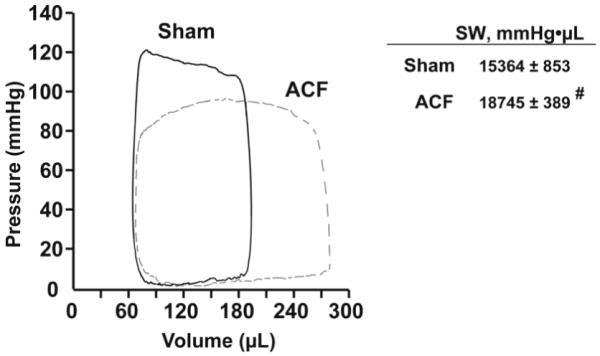
Figure 1. LV Pressure-Volume loops and LV stroke work in sham and 24hr ACF rats.

LV pressure-volume loops were obtained from simultaneous high-fidelity LV pressure catheter and echo-derived LV volumes. Representative sham (solid line) and ACF (dashed line) LV pressure volume loops demonstrate the characteristic increase in pressure volume area with volume overload. On the right, LV stroke work (SW) is increased in the ACF rats. Data is presented as mean ± SE, # p<0.05 vs. sham (n=5 per group).
