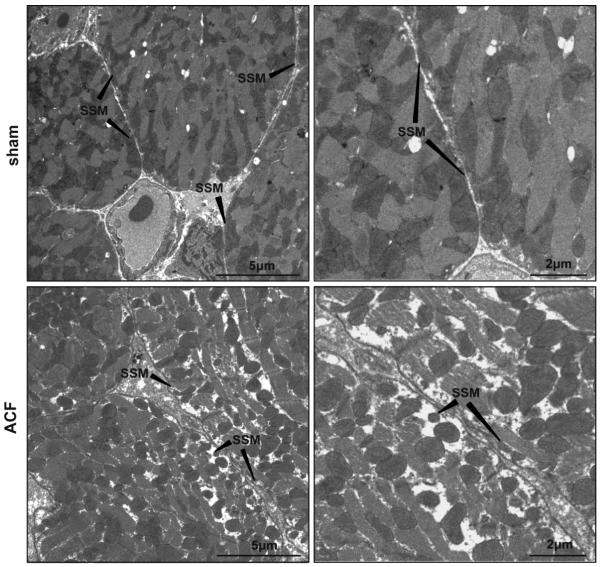
Figure 8. Transmission electron microscopic transverse images of LV cardiomyocytes from sham and ACF rats.
TEM images of LV cardiomyocyte in sham rats demonstrates the tight arrangement of mitochondria below the sarcolemmal membrane (pointed with arrows). In the ACF rats, there is a decrease in density of SSM with more space between them, consistent with decreased subsarcolemmal CcOX4 immunostaining in Figure 5.

