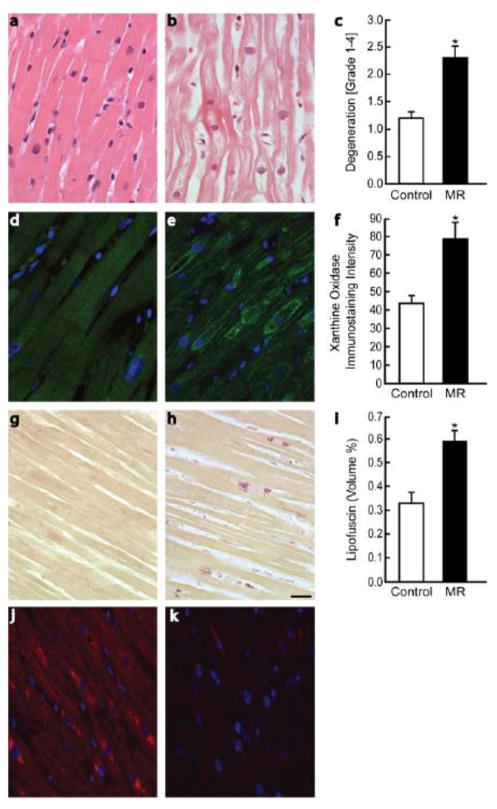
Figure 3. Myofibrillar loss and oxidative stress in patients with isolated MR.
Myocardial biopsy findings in controls (n=10) (a,d,g) and MR patients (n=27) demonstrating myofibrillar degeneration (b,c), increased xanthine oxidase (e,f), and increased lipofuscin (h,i). Nitrotyrosine staining in the LV of an MR patient demonstrating increased staining in areas of lipofuscin accumulation (j) and a corresponding image (k) with immunoabsorbed antibody with no uptake of antibody and only autofluorescence of lipofuscin. Scale bar = 20 μm. * = p <0.05 vs. normal control group. Scale bar = 20 μm.

