
Figure 6.4.5.
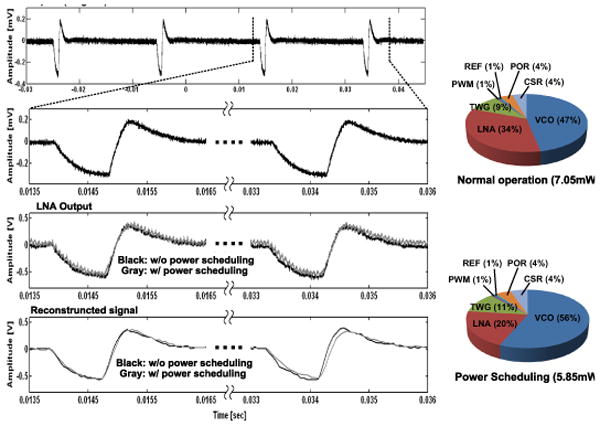
Measured waveforms from top: Original artificial spike waveform, recorded waveforms at the LNA output, sampled and pulse width demodulated waveforms. Power distribution chart among different blocks with and without power scheduling (N = 12).