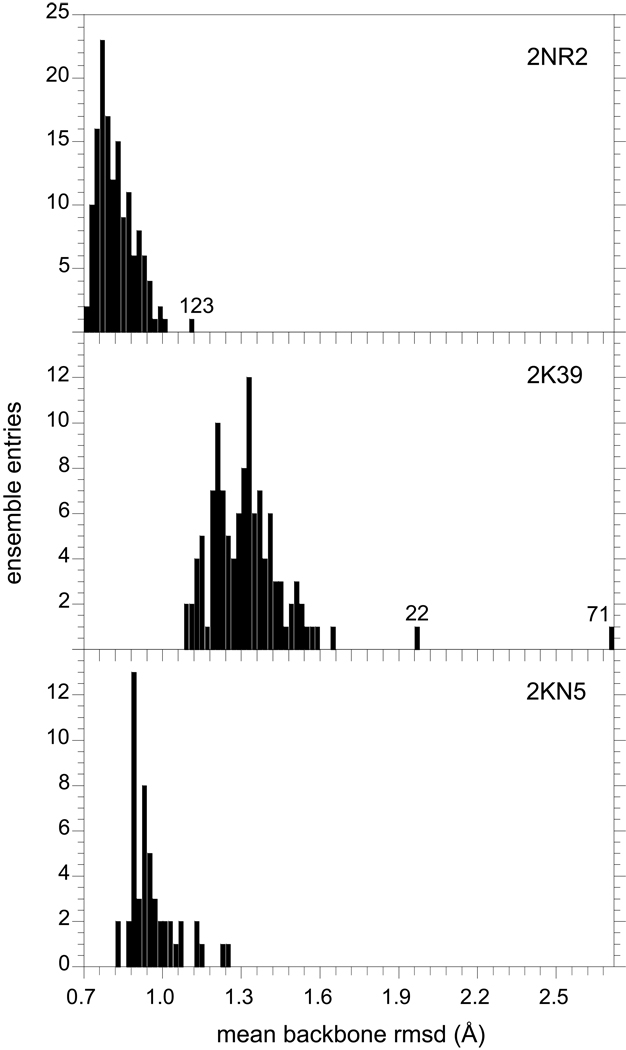
Fig. 6.
Mean intermolecular distances among ensemble conformations of ubiquitin. In top panel is illustrated the distribution of the pairwise rmsd values for the backbone C, Cα, N and O atoms in each model of the NOE, S2-restrained 2NR2 ensemble [25] with respect to the other 143 conformations in this ensemble (residues 1 to 72). The results from the analogous calculations for the 116 structures of the NOE-restrained, RDC-selected 2K39 ensemble [28] and the 50 structures of the Backrub-sampled, RDC-selected 2KN5 ensemble are given in the lower two panels, respectively. Several conformations that lie at the extreme of their ensemble distribution are indicated by their PDB model number.

