Figure 6.
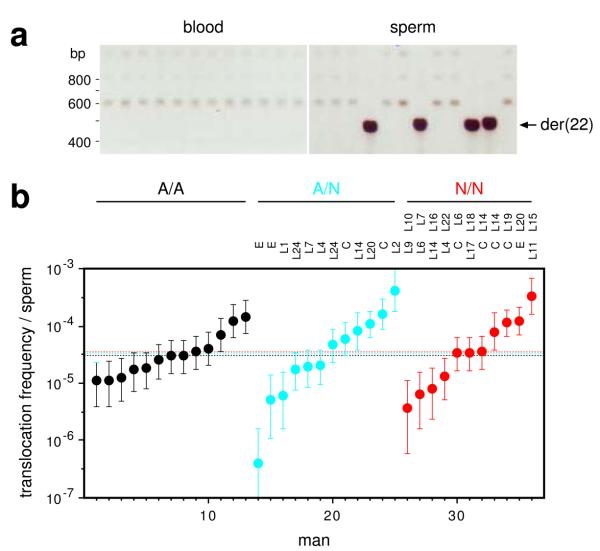
PRDM9 variation and t(11;22) translocation frequencies. (a) Detection of de novo der(22) translocation junctions by nested PCR amplification29 of multiple 150 ng aliquots of blood and sperm DNA. Minor variation in junction size results from differences in translocation breakpoint locations within the PATRR24. (b) der(22) translocation frequencies, with CIs, in sperm DNA in PRDM9 A/A, A/N and N/N men, with identities of N alleles shown above. The median frequency per group, similar to previously-reported translocation frequencies24, is indicated by a dotted line. There is no significant difference in translocation frequency between groups (Kruskal-Wallis test, P = 0.98). No de novo translocations were seen in blood DNA tested from four different men (frequency < 5×10⁻⁷, P > 0.95).

