
Figure 4.
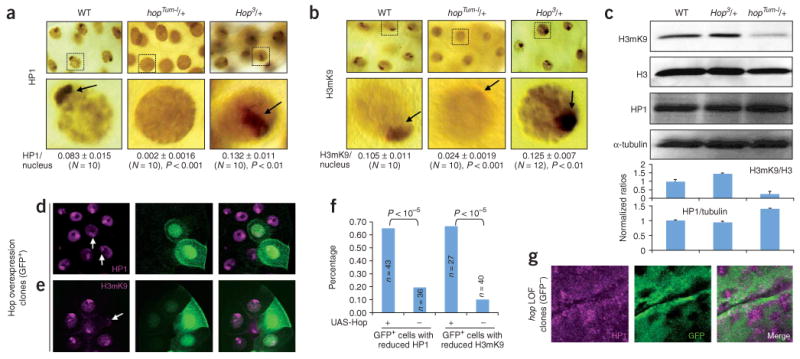
JAK gain of function decreases, and loss of function increases, HP1 and H3mK9 localization on heterochromatin. (a) Representative giant nuclei of salivary glands of indicated genotypes stained with anti-HP1. HP1 signals on heterochromatin (dark brown stain and arrow) are decreased in hopTum-l and increased in hop3 heterozygotes. Quantifications are shown as the ratio of the area of HP1-positive focus (centromeric heterochromatin) versus the area of the nucleus. We used ten represented nuclei from different stained salivary glands for quantification. (b) H3mK9 signals are higher in hopTum-l and lower in hop3 heterozygotes than in wild type. Quantification of H3mK9 staining was done as above. (c) Protein blots of total proteins extracted from 40 12- to 24-h-old embryos from females of indicated genotypes. The membrane was blotted with anti-H3mK9, stripped and sequentially blotted with anti-H3, anti-HP1 and anti-α-tubulin. More than three independent blots were performed and the gel bands were quantified; ratios (± s.d.) are shown at bottom. (d,e) Overexpression of Hop (JAK overactivation) in salivary gland cells (marked by GFP (green)) result in decreased levels of HP1 (d) and H3mK9 (e). (f) Reductions in HP1 or H3mK9 were quantified for all GFP+ cells found in third instar salivary glands with indicated transgene combination. Control animals did not contain UAS-Hop. The differences were analyzed by χ2 test. (g) Increased HP1 levels are detected in hop loss-of-function (LOF) homozygous clones (marked by a lack of GFP). Part of a third instar imaginal disc is shown.