Figure 2.
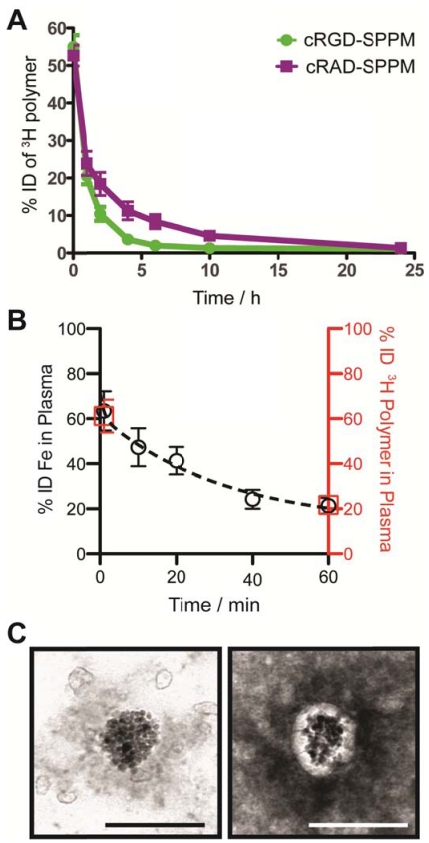
Measurement of the pharmacokinetics and structural integrity of SPPM nanoprobes. (A) Plasma concentration-time relationships (n=3 for each group) for cRGD-SPPM (green line) and cRAD-SPPM (purple line) using 3H-labeled polymers over 24 hrs. (B) Short-term plasma concentration-time relationships measured by Fe content (black open circles) after a bolus injection of cRGD-SPPM (10 mg Fe/kg). Data from radiolabeled polymers (1 min and 60 mins) are shown as red open squares. (C) TEM micrographs of plasma samples that were collected 40 mins after bolus injection of cRGD-SPPM. The sample was negatively stained with 2% PTA solution (right micrograph). Scale bars = 100 nm.

