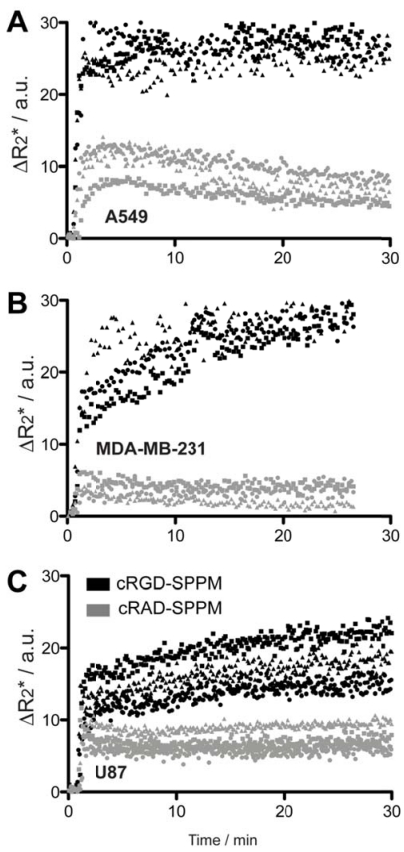
Figure 3.
Mean ΔR2* curves of tumor ROI from cRGD- (black symbols) and cRAD-SPPM (gray symbols) in mice bearing A549 (A), MDA-MB-231 (B) or U87 (C) subcutaneous xenografts (n=3 for each xenograft group). Squares, circles and triangles indicate the mean of three measured ROIs from one animal in each group. cRGD-SPPM tumor hot-spot ROIs (black symbols) show a continuous increase in the ΔR2* over 30 mins, indicating SPPM accumulation in tumor tissues. In comparison, the ΔR2* values from cRAD-SPPM treated animals (gray symbols) show a maintained or trend toward baseline indicating clearance from the tumor tissue.

