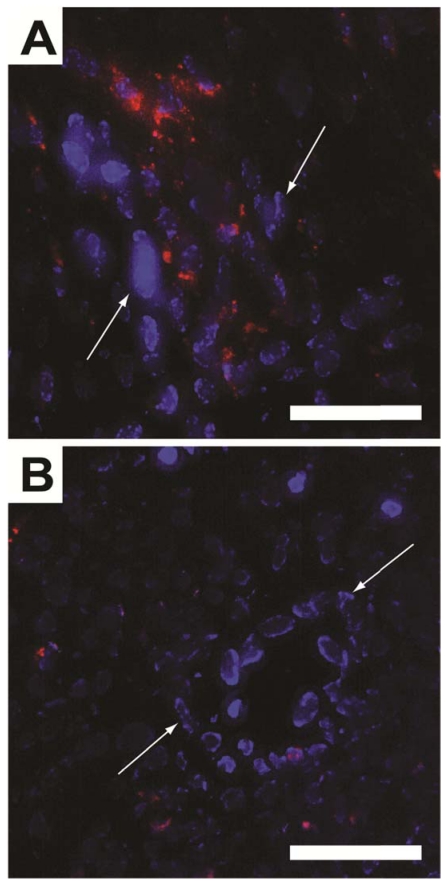
Figure 5.
Fluorescence micrographs of cryo-sectioned A549 tumor xenografts from cRGD- (A) and cRAD-SPPM (B) treated animals. Endothelial cells from highly perfused vessels (white arrows) are stained with Hoechst (blue). This staining is caused by the limited circulation time (1 min) of the Hoechst dye. cRGD-SPPMs are shown tightly associated with these vessels (A, red fluorescence), whereas cRAD-SPPMs are dispersed in a lesser content throughout the tumor parenchyma (B, red fluorescence). Scale bars = 50 µm.

