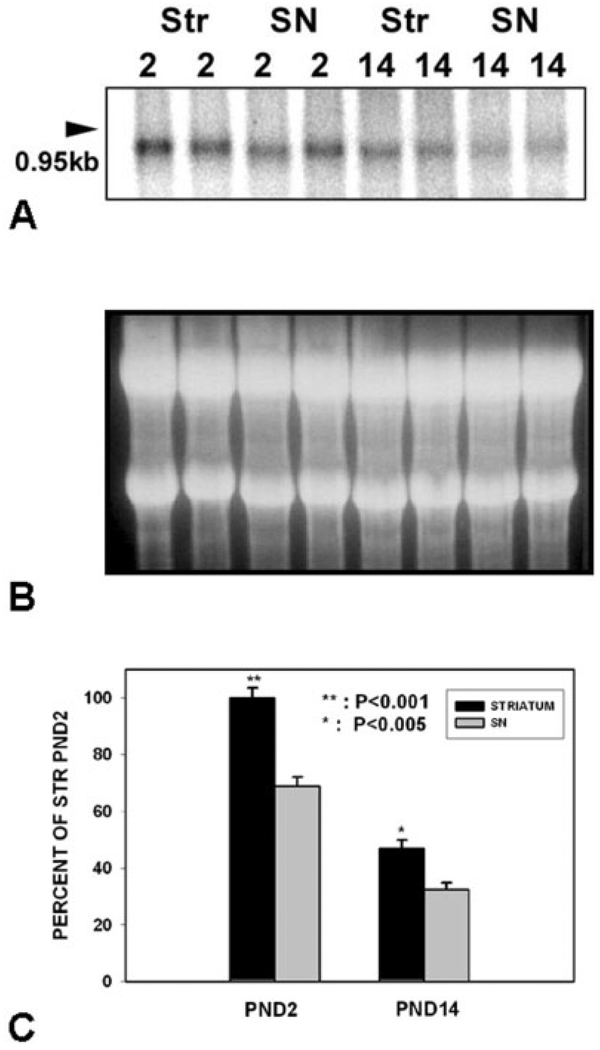
Fig. 1.
Relative levels of GDNF mRNA in striatum and SN at the two phases of NCD in SN. A: Representative Northern analysis of GDNF mRNA expression in striatum and SN at PND2 (n = 2 for each region) and PND14 (n = 2 for each region). B: An ethidium bromide stain of the gel demonstrates equal loading of the lanes. C: Quantitative analysis of GDNF mRNA expression in striatum and SN at the two phases of NCD in SN (n = 8 for each condition). Note that mRNA levels were relatively greater in striatum than SN during both phases of NCD, but particularly at PND2 (P < 0.001 at PND2, P < 0.005 at PND14).

