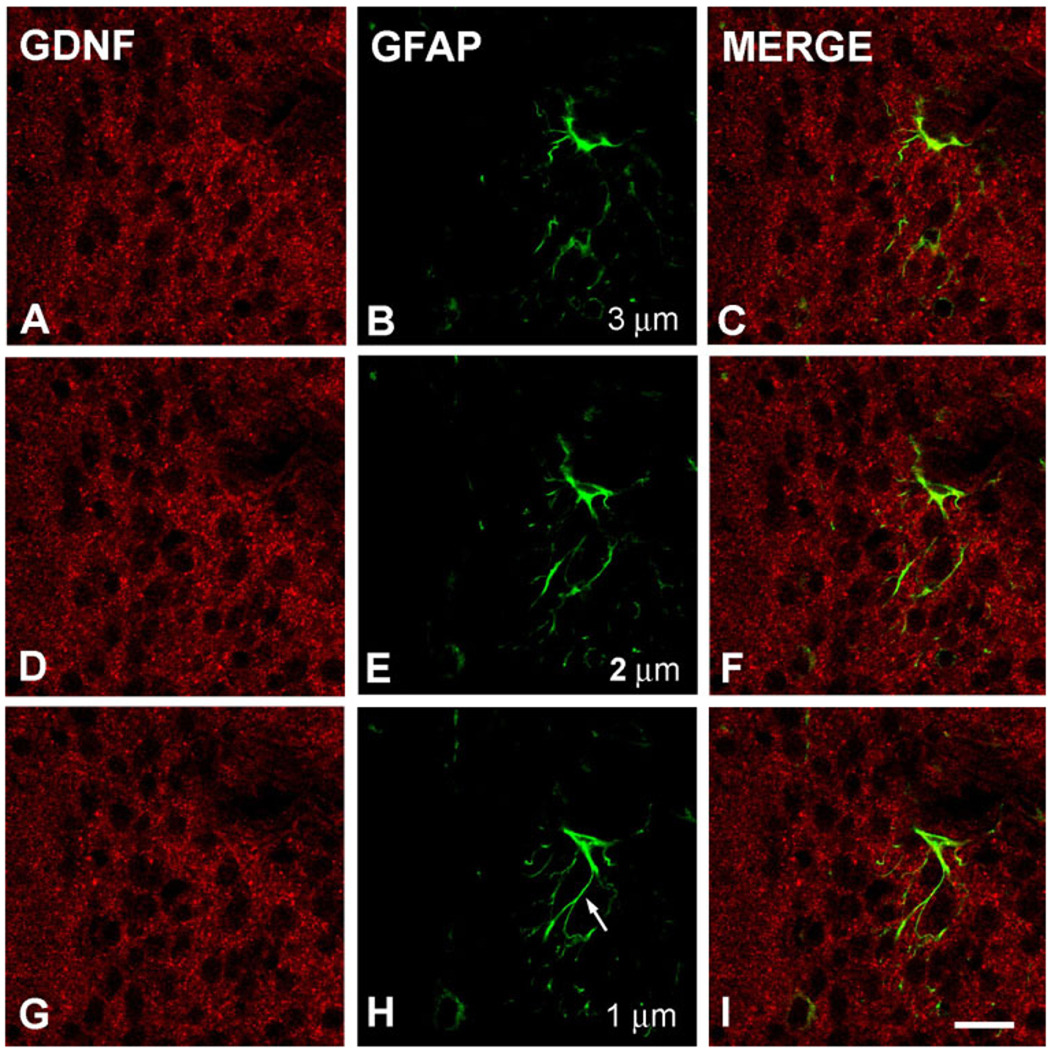
Fig. 5.
Immunofluorescence labeling of GDNF and GFAP. Shown are three consecutive confocal planes, each labeled for GDNF (A,D,G) and GFAP (B,E,H) and merged (C,F,I) in a PND6 rat. The micron measurements in panels B, E, and H represent the Z-axis distances above the plane shown in H, arbitrarily defined as the initial plane at 1 µm. There is no cellular colocalization of the GDNF and GFAP staining. This is especially clear visually for the astrocyte fiber shown in panel H (arrow). Scale bar = 10 µm in I (applies to A–I).

