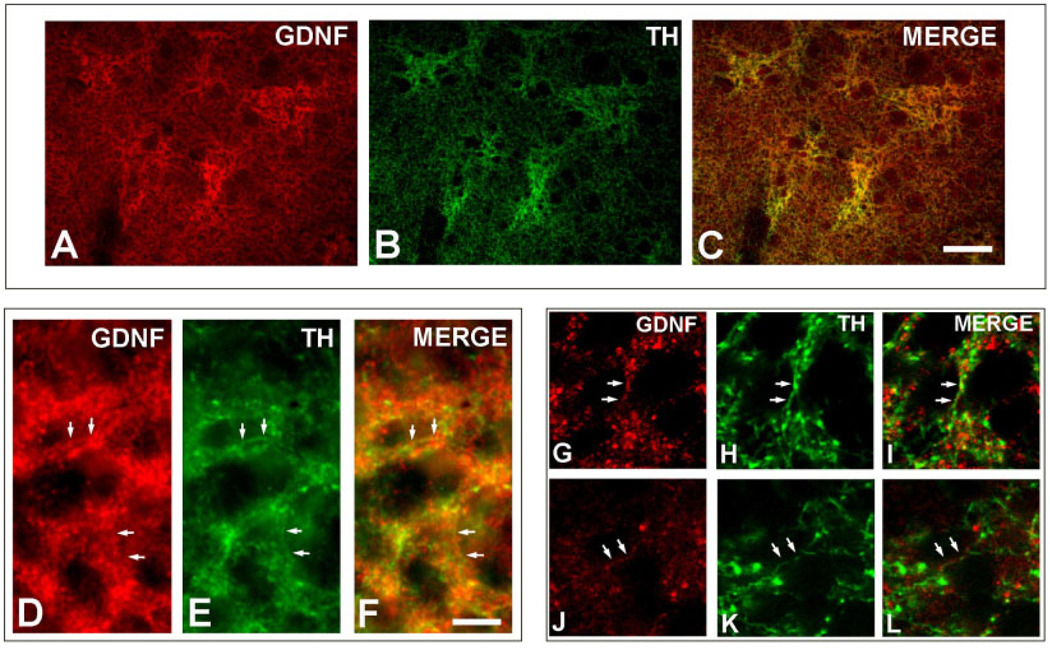
Fig. 6.
Immunofluorescence labeling of GDNF and TH. A lower-power epifluorescence micrograph demonstrates a correspondence between striosomes identified by GDNF staining (A) and those identified by TH staining (B), as shown in the merged image (C). At higher power, epifluorescence demonstrates colocalization of GDNF (D) and TH (E) in striosomal fibers (merged in F) (examples of colocalization are indicated by pairs of white arrows). Colocalization is confirmed by confocal analysis. Two representative examples are shown in panel sets G–I and J–L. Scale bars = 100 µm in C (applies to A–C); 10 µm in F (applies to D–L).

