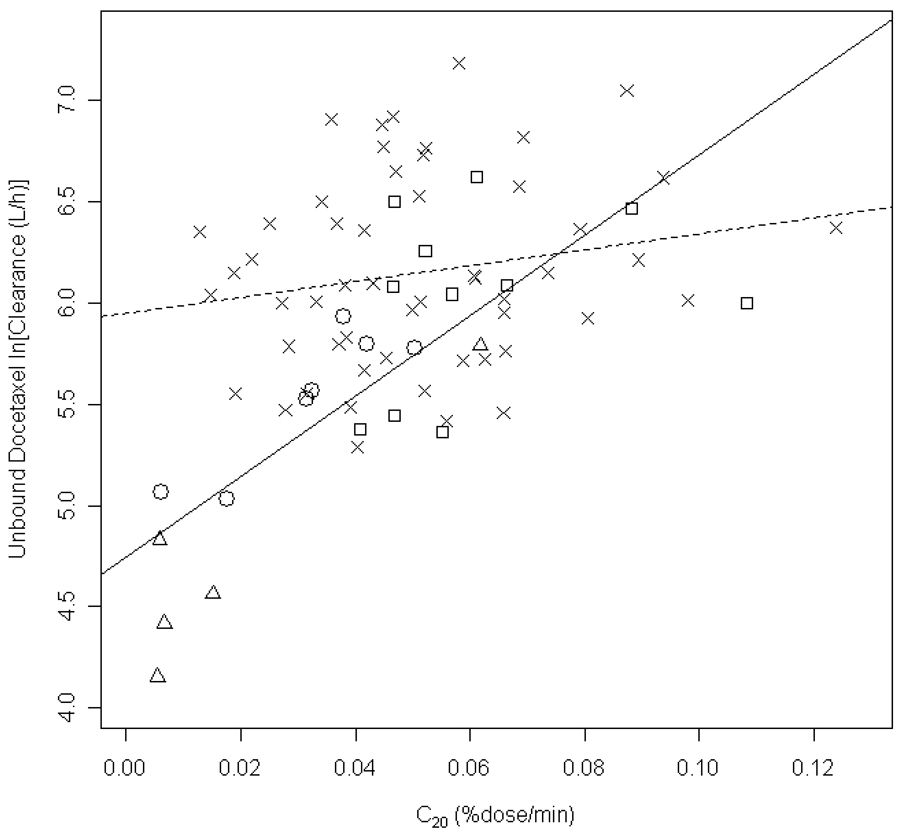
Figure 4.
Association between the erythromycin breath test variable C20,min, and log-transformed unbound docetaxel, estimated from the final population pharmacokinetic model. The symbol (x), represents patients with normal liver function, and the symbols (□), (○), and (Δ) represent patients with liver function abnormalities in liver function groups 2, 3A, and 3B, respectively. The dashed line is a linear-regression analysis of data in patients with normal liver function (R2 = 0.03547; P = 0.177), and the solid line is from data in patients with liver function abnormalities (R2 = 0.603, P<0.0001).

