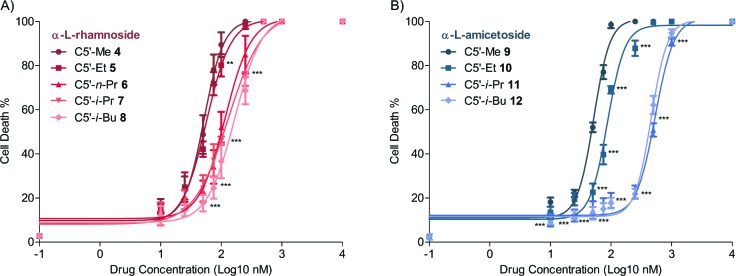
Figure 3.
Cytotoxicity as a function of drug concentration in the comparison of C5′-alkyl substitution. Dose response curve of total cell death (apoptosis/necrosis) mediated by digitoxin analogues in a 12 h treatment at increasing concentrations (10 nM to 10 μM). All the data were analyzed by two-way ANOVA (N = 6; *, P < 0.05; **, P < 0.01; ***, P < 0.001).

