
Figure 3.
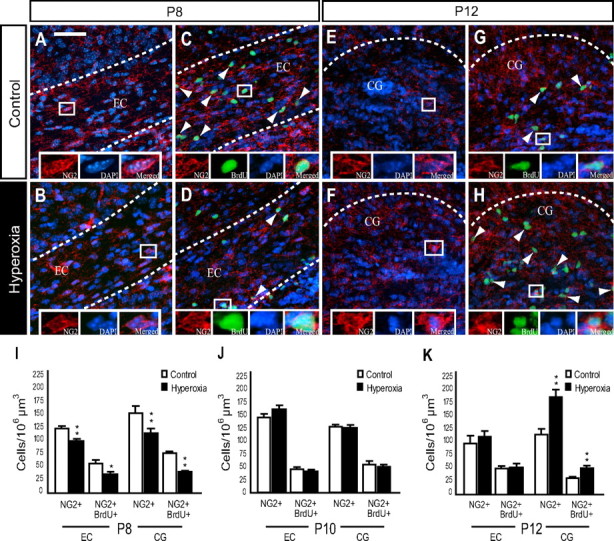
Time-dependent changes in white matter NG2+ oligodendrocyte progenitor cells after hyperoxia. A, B, Confocal images of NG2+ progenitors under control conditions or after hyperoxia in WT mice at P8. C, D, Confocal images of NG2+BrdU+ progenitors in control versus hyperoxia WT mice at P8. E, F, Images of NG2+ progenitors in the control versus hyperoxia group in WT mice at P12. G, H, NG2+BrdU+ progenitors control versus hyperoxia in WT mice at P12. Arrowheads indicate respective triple immunolabeling. I, Decrease in the total number of NG2+ and NG2+BrdU+ cells in the EC and in the CG at P8. J, At P10, the total number of NG2+ and NG2+BrdU+ cells in the hyperoxia group returned to control levels in both WM areas of interest. K, Increase in NG2+ and NG2+BrdU+ cells within the CG of the hyperoxia group at P12. Total numbers of NG2+ and NG2+BrdU+ returned to control levels within the EC. Scale bar, 50 μm. Data are shown as mean ± SD (n = 3–5 brains for each group, using an unpaired t test comparing control vs hyperoxia; *p < 0.05; **p < 0.025).